2026/05/16 遅延がどうのこうの・・Ryzen 9 9900X3D 用のmemo
03:17
続きともいうっぱね((´Θ`))
ばんわっぱ かっぱだっぱ
((o’Θ’o≡o’Θ’o))
地震こわいっぱねぇ
おいらは火山の方が近いのでそっちがより怖いっぱが( ;・`Θ・´)ゴクリ
昨日の雑設定から自前用に詰めていたっぱ
なにかあって設定ぶっ飛んだ時に再設定したくないのでmemoるっぱ
📋️:裏手でモンハンベンチぶん回してた時のやつ大体38000スコア出る設定より**36000に落ちるような設定のほうがスパイクラグは消し込めたっぱ
ちなみに2回の1ms分ラグの元凶も突き止めてあるっぱ(。・Θ・。)チッ
Steamオーバーレイだっぱよ(ボソ
あれをきっておけば最大負荷時や読み込みや閉じた時の重みによるラグも大体の環境では回避できそうっぱ
CONCLUSION
Your system appears to be suitable for handling real-time audio and other tasks without dropouts. LatencyMon has been analyzing your system for 0:06:09 (h:mm:ss) on all processors.
SYSTEM INFORMATION
Computer name: 🥒 OS version: Hardware: B850 LiveMixer WiFi, ASRock BIOS: 4.20 CPU: AuthenticAMD AMD Ryzen 9 9900X3D 12-Core Processor Logical processors: 24 Processor groups: 1 Processor group size: 24 RAM: 63061 MB total
CPU SPEED
Reported CPU speed (WMI): 440 MHz Reported CPU speed (registry): 4392 MHz
Note: reported execution times may be calculated based on a fixed reported CPU speed. Disable variable speed settings like Intel Speed Step and AMD Cool N Quiet in the BIOS setup for more accurate results.
MEASURED INTERRUPT TO USER PROCESS LATENCIES
The interrupt to process latency reflects the measured interval that a usermode process needed to respond to a hardware request from the moment the interrupt service routine started execution. This includes the scheduling and execution of a DPC routine, the signaling of an event and the waking up of a usermode thread from an idle wait state in response to that event.
Highest measured interrupt to process latency (µs): 465.30 Average measured interrupt to process latency (µs): 12.067973
Highest measured interrupt to DPC latency (µs): 297.80 Average measured interrupt to DPC latency (µs): 1.295350
REPORTED ISRs
Interrupt service routines are routines installed by the OS and device drivers that execute in response to a hardware interrupt signal.
Highest ISR routine execution time (µs): 35.284153 Driver with highest ISR routine execution time: dxgkrnl.sys - DirectX Graphics Kernel, Microsoft Corporation
Highest reported total ISR routine time (%): 0.000377 Driver with highest ISR total time: Wdf01000.sys - カーネル モード ドライバー フレームワーク ランタイム, Microsoft Corporation
Total time spent in ISRs (%) 0.000378
ISR count (execution time =4000 µs): 0
REPORTED DPCs
DPC routines are part of the interrupt servicing dispatch mechanism and disable the possibility for a process to utilize the CPU while it is interrupted until the DPC has finished execution.
Highest DPC routine execution time (µs): 877.946266 Driver with highest DPC routine execution time: amdkmdag.sys - ATI Radeon Kernel Mode Driver, Advanced Micro Devices, Inc.
Highest reported total DPC routine time (%): 0.181826 Driver with highest DPC total execution time: amdkmdag.sys - ATI Radeon Kernel Mode Driver, Advanced Micro Devices, Inc.
Total time spent in DPCs (%) 0.375642
DPC count (execution time =4000 µs): 0
REPORTED HARD PAGEFAULTS
Hard pagefaults are events that get triggered by making use of virtual memory that is not resident in RAM but backed by a memory mapped file on disk. The process of resolving the hard pagefault requires reading in the memory from disk while the process is interrupted and blocked from execution.
NOTE: some processes were hit by hard pagefaults. If these were programs producing audio, they are likely to interrupt the audio stream resulting in dropouts, clicks and pops. Check the Processes tab to see which programs were hit.
Process with highest pagefault count: radeonsoftware.exe
Total number of hard pagefaults 4033 Hard pagefault count of hardest hit process: 1380 Number of processes hit: 51
PER CPU DATA
CPU 0 Interrupt cycle time (s): 5.493298 CPU 0 ISR highest execution time (µs): 35.284153 CPU 0 ISR total execution time (s): 0.000047 CPU 0 ISR count: 2 CPU 0 DPC highest execution time (µs): 315.744080 CPU 0 DPC total execution time (s): 0.191835 CPU 0 DPC count: 59842
CPU 1 Interrupt cycle time (s): 60.624224 CPU 1 ISR highest execution time (µs): 1.502505 CPU 1 ISR total execution time (s): 0.000003 CPU 1 ISR count: 2 CPU 1 DPC highest execution time (µs): 877.946266 CPU 1 DPC total execution time (s): 30.207558 CPU 1 DPC count: 3359898
CPU 2 Interrupt cycle time (s): 4.392539 CPU 2 ISR highest execution time (µs): 0.0 CPU 2 ISR total execution time (s): 0.0 CPU 2 ISR count: 0 CPU 2 DPC highest execution time (µs): 288.033470 CPU 2 DPC total execution time (s): 0.205481 CPU 2 DPC count: 34136
CPU 3 Interrupt cycle time (s): 5.309595 CPU 3 ISR highest execution time (µs): 0.0 CPU 3 ISR total execution time (s): 0.0 CPU 3 ISR count: 0 CPU 3 DPC highest execution time (µs): 668.846084 CPU 3 DPC total execution time (s): 0.097710 CPU 3 DPC count: 25577
CPU 4 Interrupt cycle time (s): 5.085114 CPU 4 ISR highest execution time (µs): 0.0 CPU 4 ISR total execution time (s): 0.0 CPU 4 ISR count: 0 CPU 4 DPC highest execution time (µs): 81.578324 CPU 4 DPC total execution time (s): 0.045366 CPU 4 DPC count: 19593
CPU 5 Interrupt cycle time (s): 5.892721 CPU 5 ISR highest execution time (µs): 0.0 CPU 5 ISR total execution time (s): 0.0 CPU 5 ISR count: 0 CPU 5 DPC highest execution time (µs): 73.012750 CPU 5 DPC total execution time (s): 0.145256 CPU 5 DPC count: 39342
CPU 6 Interrupt cycle time (s): 3.769242 CPU 6 ISR highest execution time (µs): 0.0 CPU 6 ISR total execution time (s): 0.0 CPU 6 ISR count: 0 CPU 6 DPC highest execution time (µs): 94.561931 CPU 6 DPC total execution time (s): 0.028866 CPU 6 DPC count: 10161
CPU 7 Interrupt cycle time (s): 4.722473 CPU 7 ISR highest execution time (µs): 0.0 CPU 7 ISR total execution time (s): 0.0 CPU 7 ISR count: 0 CPU 7 DPC highest execution time (µs): 57.654599 CPU 7 DPC total execution time (s): 0.083760 CPU 7 DPC count: 25764
CPU 8 Interrupt cycle time (s): 3.811611 CPU 8 ISR highest execution time (µs): 0.0 CPU 8 ISR total execution time (s): 0.0 CPU 8 ISR count: 0 CPU 8 DPC highest execution time (µs): 76.529144 CPU 8 DPC total execution time (s): 0.035241 CPU 8 DPC count: 11472
CPU 9 Interrupt cycle time (s): 4.253579 CPU 9 ISR highest execution time (µs): 0.0 CPU 9 ISR total execution time (s): 0.0 CPU 9 ISR count: 0 CPU 9 DPC highest execution time (µs): 132.200364 CPU 9 DPC total execution time (s): 0.074415 CPU 9 DPC count: 19151
CPU 10 Interrupt cycle time (s): 2.955548 CPU 10 ISR highest execution time (µs): 0.0 CPU 10 ISR total execution time (s): 0.0 CPU 10 ISR count: 0 CPU 10 DPC highest execution time (µs): 43.388889 CPU 10 DPC total execution time (s): 0.025029 CPU 10 DPC count: 9145
CPU 11 Interrupt cycle time (s): 3.516418 CPU 11 ISR highest execution time (µs): 0.0 CPU 11 ISR total execution time (s): 0.0 CPU 11 ISR count: 0 CPU 11 DPC highest execution time (µs): 546.473588 CPU 11 DPC total execution time (s): 0.072312 CPU 11 DPC count: 18341
CPU 12 Interrupt cycle time (s): 8.113237 CPU 12 ISR highest execution time (µs): 27.269581 CPU 12 ISR total execution time (s): 0.016017 CPU 12 ISR count: 7563 CPU 12 DPC highest execution time (µs): 119.176685 CPU 12 DPC total execution time (s): 0.438302 CPU 12 DPC count: 43108
CPU 13 Interrupt cycle time (s): 8.037271 CPU 13 ISR highest execution time (µs): 20.747495 CPU 13 ISR total execution time (s): 0.016239 CPU 13 ISR count: 7796 CPU 13 DPC highest execution time (µs): 114.768670 CPU 13 DPC total execution time (s): 0.446568 CPU 13 DPC count: 42774
CPU 14 Interrupt cycle time (s): 6.019782 CPU 14 ISR highest execution time (µs): 14.496357 CPU 14 ISR total execution time (s): 0.000797 CPU 14 ISR count: 566 CPU 14 DPC highest execution time (µs): 225.670082 CPU 14 DPC total execution time (s): 0.078155 CPU 14 DPC count: 23665
CPU 15 Interrupt cycle time (s): 5.688811 CPU 15 ISR highest execution time (µs): 19.365209 CPU 15 ISR total execution time (s): 0.000374 CPU 15 ISR count: 373 CPU 15 DPC highest execution time (µs): 91.155738 CPU 15 DPC total execution time (s): 0.125318 CPU 15 DPC count: 36542
CPU 16 Interrupt cycle time (s): 6.723198 CPU 16 ISR highest execution time (µs): 0.0 CPU 16 ISR total execution time (s): 0.0 CPU 16 ISR count: 0 CPU 16 DPC highest execution time (µs): 80.937158 CPU 16 DPC total execution time (s): 0.083769 CPU 16 DPC count: 28992
CPU 17 Interrupt cycle time (s): 6.610880 CPU 17 ISR highest execution time (µs): 0.0 CPU 17 ISR total execution time (s): 0.0 CPU 17 ISR count: 0 CPU 17 DPC highest execution time (µs): 104.279599 CPU 17 DPC total execution time (s): 0.113862 CPU 17 DPC count: 35127
CPU 18 Interrupt cycle time (s): 6.671435 CPU 18 ISR highest execution time (µs): 0.0 CPU 18 ISR total execution time (s): 0.0 CPU 18 ISR count: 0 CPU 18 DPC highest execution time (µs): 79.815118 CPU 18 DPC total execution time (s): 0.090080 CPU 18 DPC count: 30271
CPU 19 Interrupt cycle time (s): 6.630520 CPU 19 ISR highest execution time (µs): 0.0 CPU 19 ISR total execution time (s): 0.0 CPU 19 ISR count: 0 CPU 19 DPC highest execution time (µs): 82.068989 CPU 19 DPC total execution time (s): 0.105453 CPU 19 DPC count: 31563
CPU 20 Interrupt cycle time (s): 5.829478 CPU 20 ISR highest execution time (µs): 0.0 CPU 20 ISR total execution time (s): 0.0 CPU 20 ISR count: 0 CPU 20 DPC highest execution time (µs): 94.521858 CPU 20 DPC total execution time (s): 0.069588 CPU 20 DPC count: 19390
CPU 21 Interrupt cycle time (s): 5.524886 CPU 21 ISR highest execution time (µs): 0.0 CPU 21 ISR total execution time (s): 0.0 CPU 21 ISR count: 0 CPU 21 DPC highest execution time (µs): 239.244763 CPU 21 DPC total execution time (s): 0.149082 CPU 21 DPC count: 35922
CPU 22 Interrupt cycle time (s): 6.132884 CPU 22 ISR highest execution time (µs): 0.0 CPU 22 ISR total execution time (s): 0.0 CPU 22 ISR count: 0 CPU 22 DPC highest execution time (µs): 93.309654 CPU 22 DPC total execution time (s): 0.142692 CPU 22 DPC count: 27416
CPU 23 Interrupt cycle time (s): 5.329771 CPU 23 ISR highest execution time (µs): 0.0 CPU 23 ISR total execution time (s): 0.0 CPU 23 ISR count: 0 CPU 23 DPC highest execution time (µs): 116.201275 CPU 23 DPC total execution time (s): 0.212608 CPU 23 DPC count: 38889
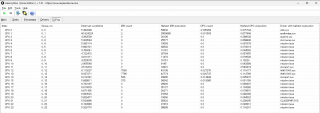
正直ここが大事っぱ(´・Θ・`)⋯
大体のアプリは雑にCPU1を消費しようとするテロを行うっぱよねぇ・・
このCPUの場合CCD0(CPU0-11)をあけておかないと ゲームが最適に動かないおそれがあるので ゲームへの割り当ては自動設定に期待して
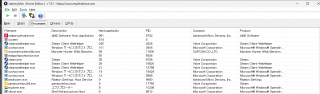
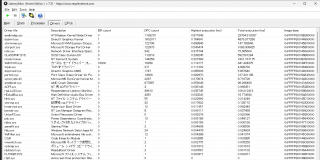
GPUやAudioは触らずに・・ NICだけ優先設定と専用コア割り当てて 他はCCD1(12-23)に適時割り当てたほうがいいっぱけど
ここまでいろいろ設定したけど正直にいって
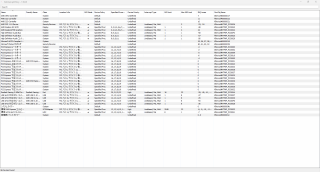
触るべきはMSI漏れを埋めて
NICをCCD1側で優先度HIGHで割り当てるだけ
それでもいいような気がするっぱねぇ・・
割りと真面目に大きく影響が出るのはそこだったっぱねぇ・・( ’Θ`)ウーン
通信手段が多いマザボやアダプタ増設してる民の場合は影響大だの
あと
無闇矢鱈にコア割り当てしてもその分遅延になる可能性があるっぱ
だけど
1つのコアだけに期待して動作させると冷却動作しだした時に遅延になるので 2つのコアにまたがるように設定する必要もあるっぱ・・(ブツブツ
ごく数日前のWindowsUpdateで
自動的に多少最適化される疑惑があるっぱからの( ’Θ`)ウーン
噂だと一瞬だけオーバークロックされて
高速動作をメニューを開いたりアプリを開いた時にやるようになった疑惑があるみたいっぱね?
MS、「Windows 11」でアプリの起動などを高速化する「低遅延プロファイル」をテスト中 - ZDNET Japan** https://japan.zdnet.com/article/35247435/
検証動画とかもぽつぽつ上がってる様子っぱが(´Θ`*)
Insider Preview に参加してる方はさくさくになるみたいっぱよ?
まああれだの(´・Θ・`)
アプリ名や自分が使ってるマザーボードやCPUやグラフィックとかの構成含めて
ChatAIに説明してから
LatencyMon動かしながらベンチマークとかとって 高負荷時はこういう状態で!とログテキストと画像を渡して 通常動作で半日ぐらい使った時のログと画像も渡しておけば
一昔前の化石LLMに質問したんじゃなければ大丈夫ではないっぱかのぅ?
(´Θ`*)あ、おいらは化石にきいたっぱ・・
🖥️ヾ(・Θ・` )ォィォィ 新しいCPUしらないっぱか? こういう仕様でこうこうこうで・・
CCD0とCCD1で跨ると遅延原因になるので極力避けつつ(ブツブツ
ただのぅ・・
これで大体のゲームはたぶん大丈夫だとは思うっぱが
様子見だっぱの
あんまり良くなかったら
先日ぼやいてある構成に少し手を付けた
最小構成にする予定っぱ((´Θ`))ケラケラ
かっぱでしたっぱ♪